Clinical Study Performance Report
An exploratory, prospective, single centre method comparison study between Synovo's Digital Disease Activity Score (DDAS) and the DAS28, the clinical reference standard used in rheumatology clinics worldwide, conducted at the Aap Ka Clinic Research Centre, Lahore, Pakistan. The dataset covers 113 paired assessments from 61 participants across the full disease activity spectrum, with 31 participants followed across two or more visits to test tracking over time.
Overview
Synovo has completed an exploratory single centre study comparing its Digital Disease Activity Score with the DAS28 clinical reference standard, conducted at the Aap Ka Clinic Research Centre, Lahore, Pakistan under that clinic's IRB, approved 21 October 2025. It was not an NHS study; the Bedfordshire NHS clinical audit is a separate activity. The dataset spans 113 paired assessments from 61 participants across remission, low, moderate and high disease activity. Thirty participants attended once and 31 attended twice or more, giving 52 within patient transitions to test whether the score can track real world disease progression and treatment response.
The result is clear. The DDAS now produces clinician grade disease activity scores from a smartphone, with statistical performance that meets the threshold for clinical equivalence and longitudinal performance that matches in clinic monitoring point for point.
Key findings
Correlation
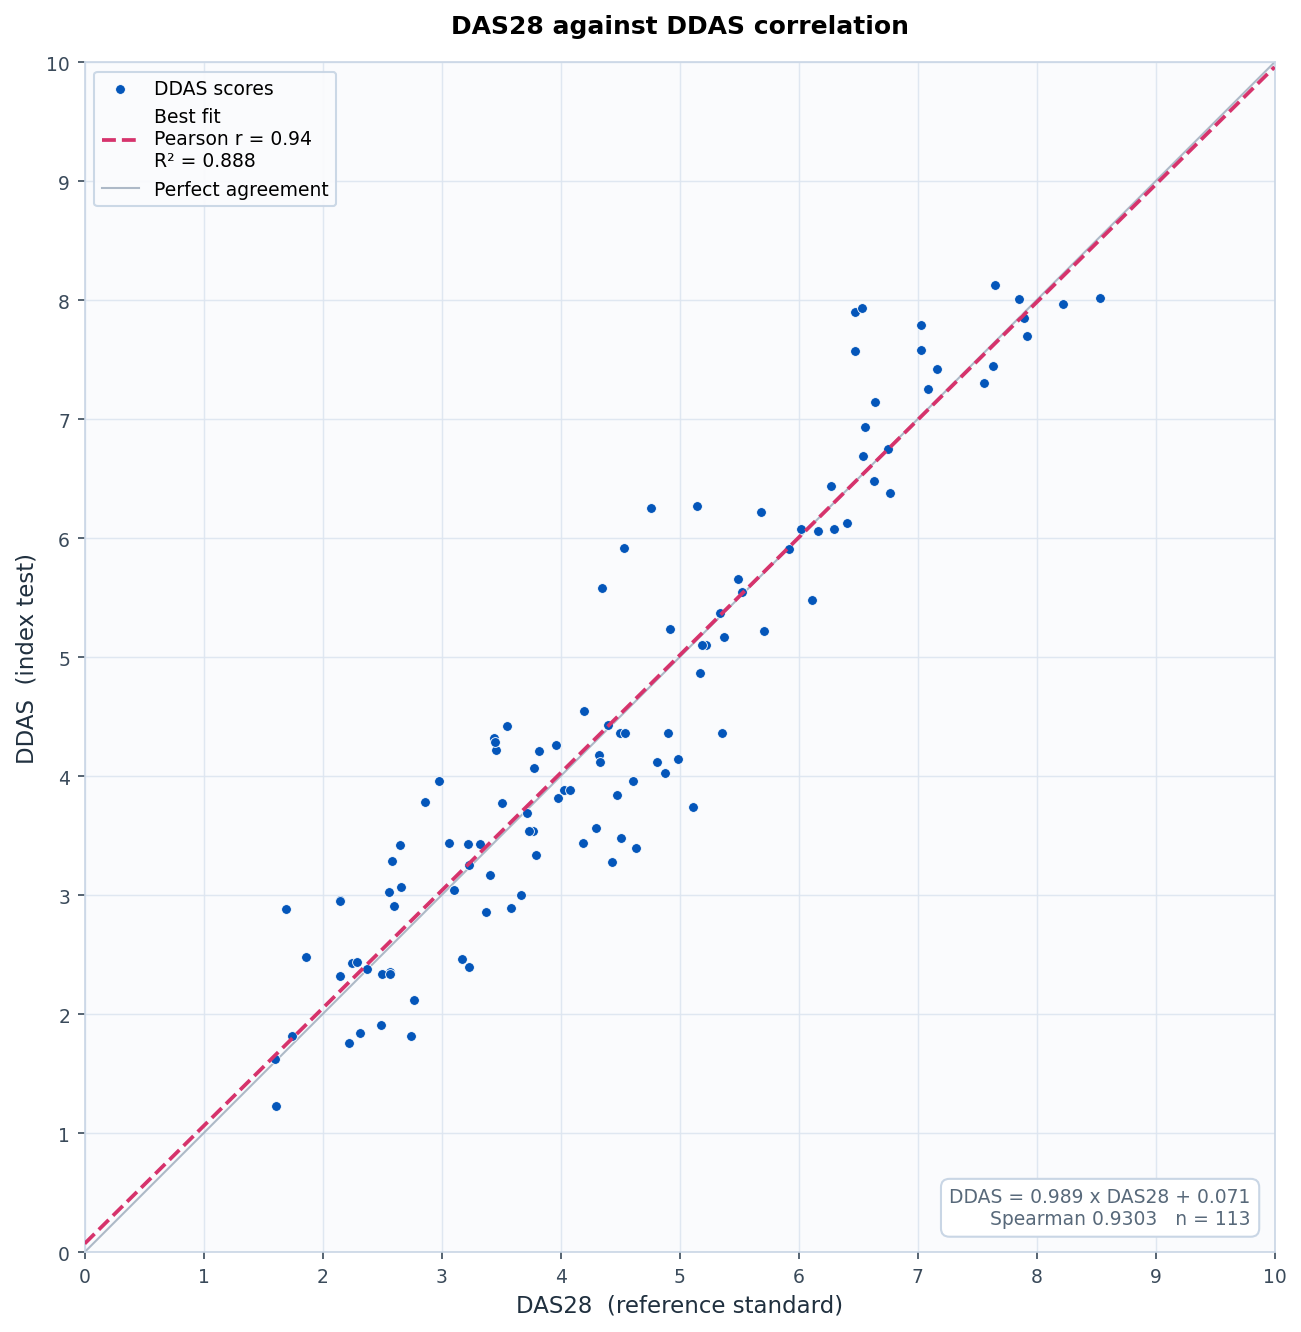
Pearson r of 0.94, 95% confidence interval 0.92 to 0.96, and R squared of 0.89 between DDAS and DAS28. Spearman rank correlation of 0.93 and an intraclass correlation of 0.94 confirm the same relationship without assuming a linear form.
Slope
The best fit line is DDAS = 0.99 x DAS28 + 0.07. A slope of 0.99 with an intercept of 0.07 means the two scores sit on the same scale and move together at the same rate, with no scaling or calibration required.
Interpretation. In the earlier pilot the slope was compressed, capturing the right pattern at a different magnitude. With balanced sampling and a refined algorithm, the digital and clinical scores have now converged. The practical implication is significant: a remote smartphone assessment can produce a disease activity score that a rheumatologist reads with the same framework they use today, with no retraining and no parallel scoring system.
Longitudinal validation: follow up accuracy
A correlation at a single visit shows the score reads disease activity correctly. A correlation across follow up visits shows whether the system can monitor patients between appointments, which is the question that matters for clinical adoption.
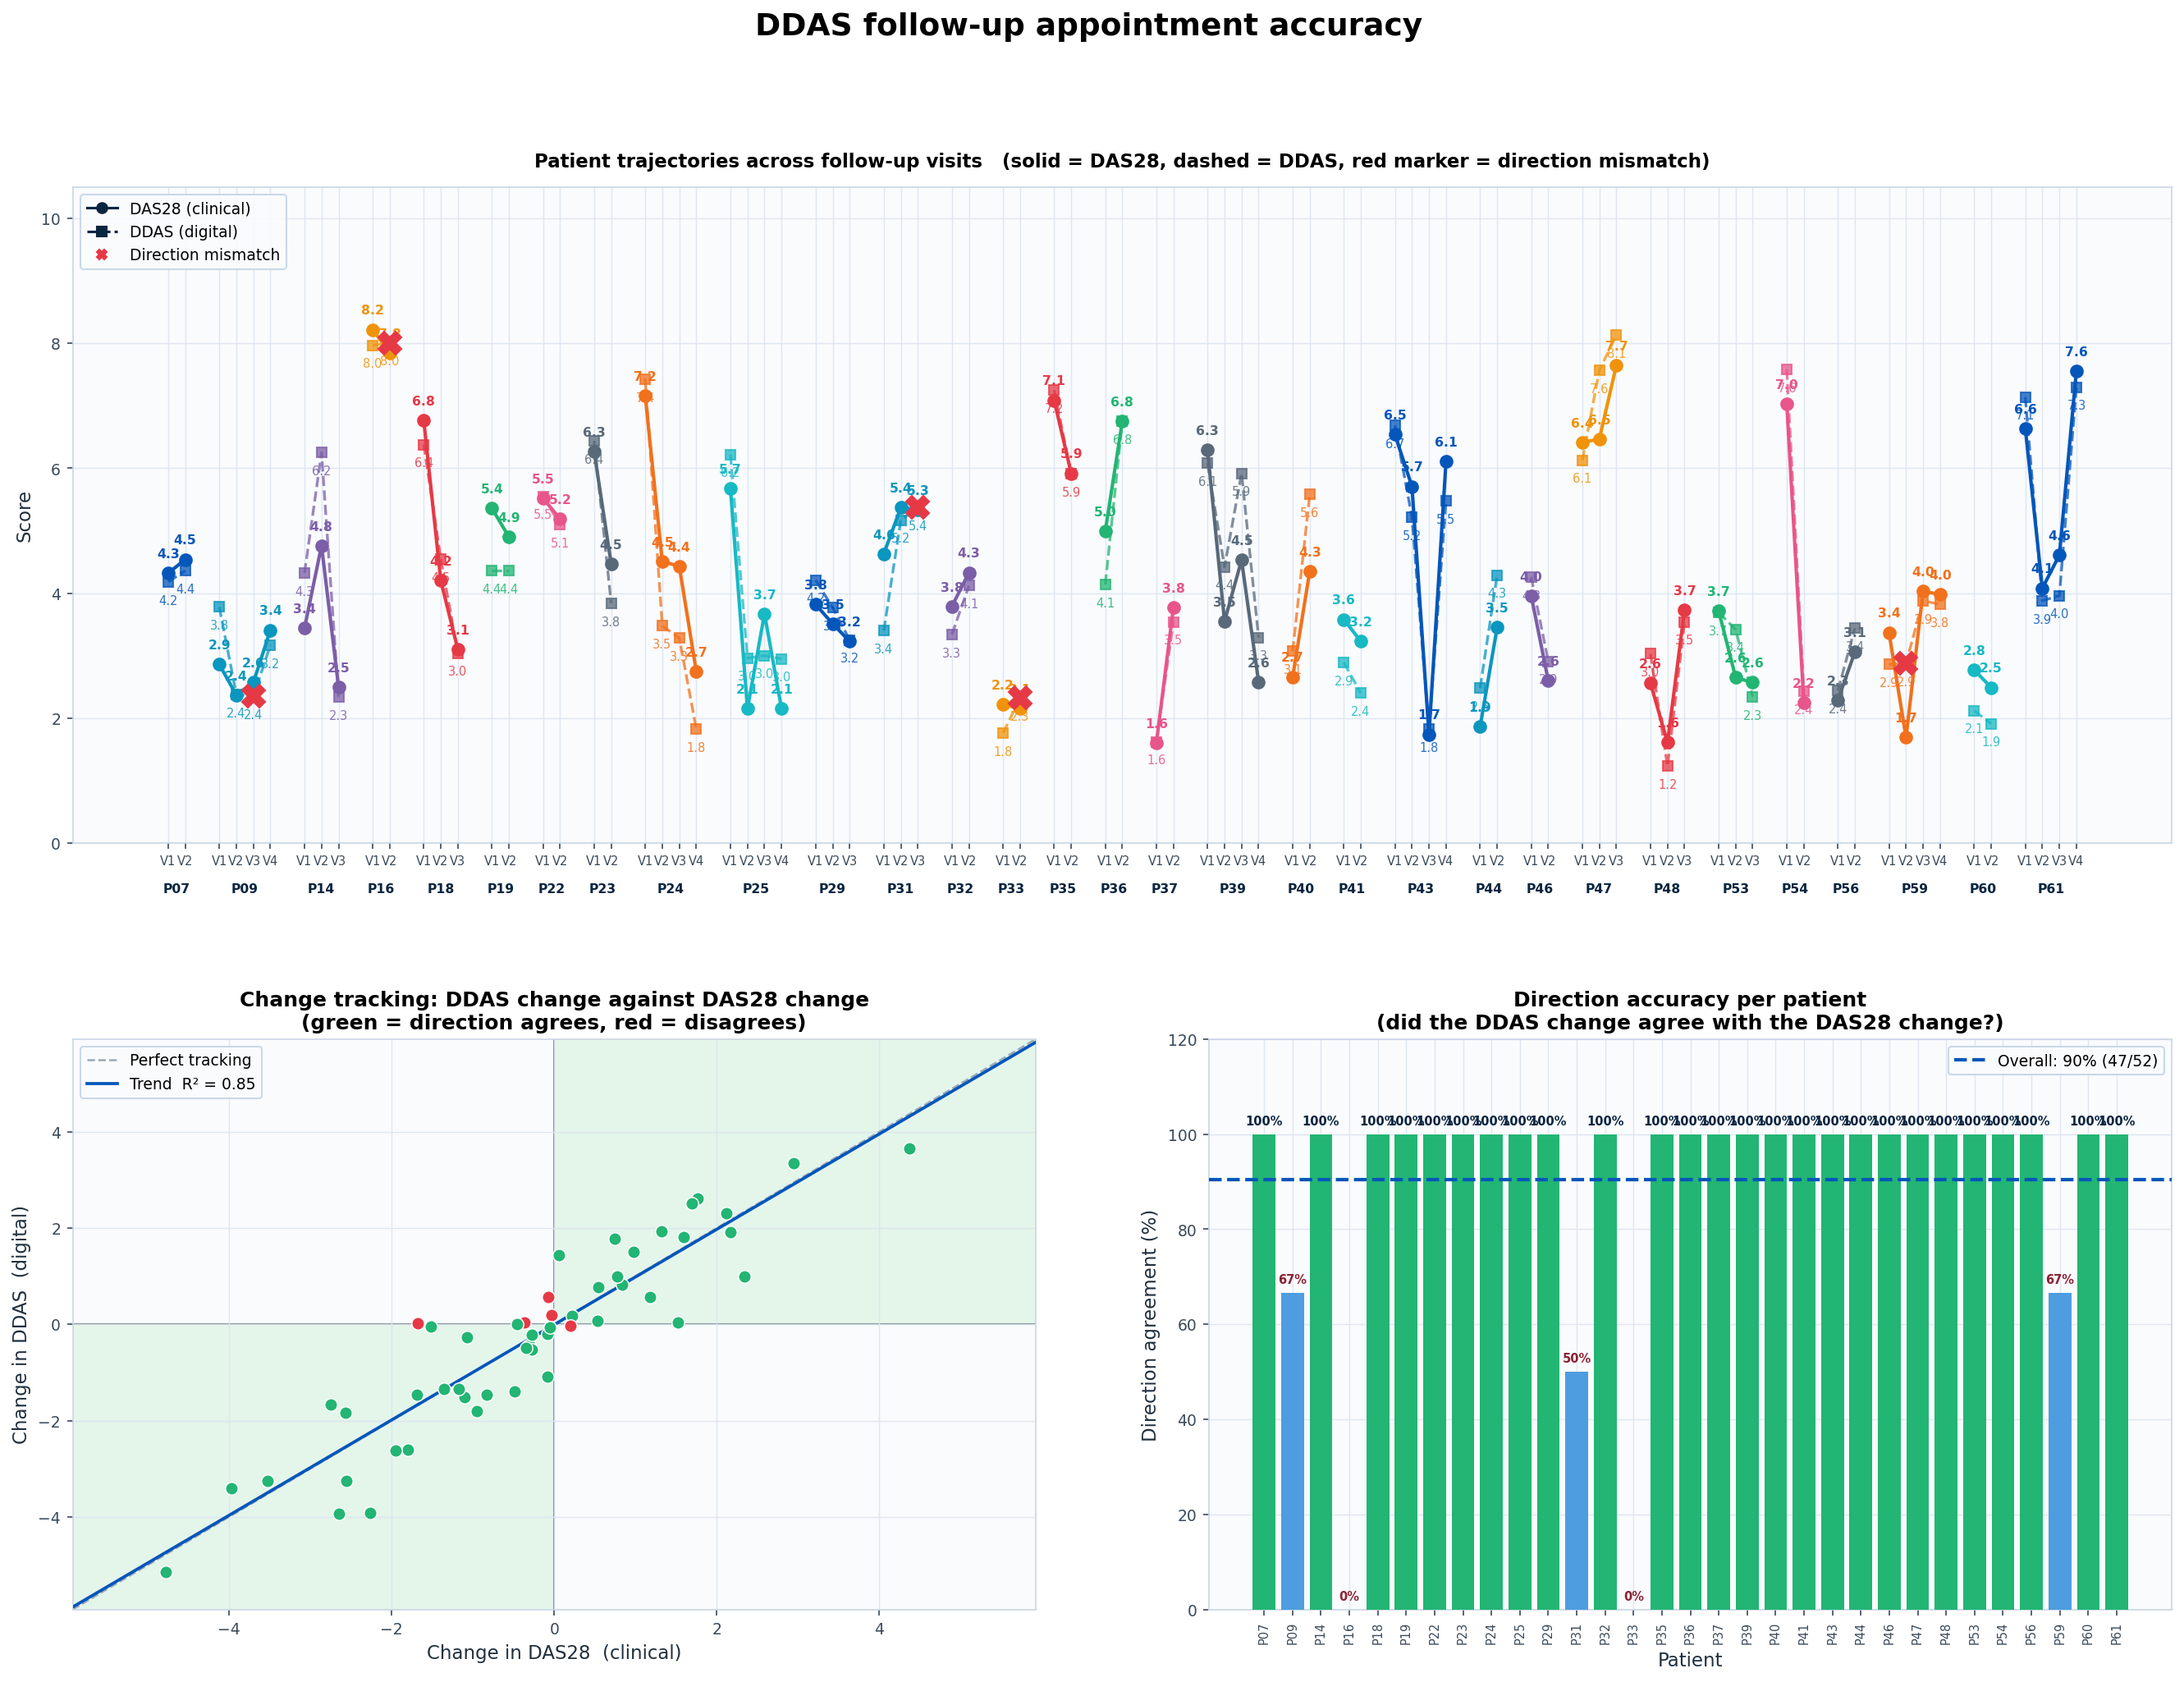
Thirty one participants were assessed across two or more follow up visits, giving 52 within patient transitions where both DAS28 and DDAS were recorded.
- Direction agreement, 90.4 percent, 47 of 52 transitions. When the clinical DAS28 rose, the DDAS rose; when it fell, the DDAS fell. Where DAS28 moved by 0.6 points or more, the clinically meaningful threshold, agreement rose to 97.1 percent, 33 of 34 transitions. Of the five mismatches, four occurred where DAS28 moved by less than 0.6 points. The fifth was a clinically meaningful change on DAS28 that the digital score did not register, which the study reports as a limitation.
- Change tracking, R squared of 0.85 between the change in DDAS and the change in DAS28. Beyond moving in the right direction, the size of the change tracked closely, so the score detects not just whether a patient is improving or deteriorating, but by how much.
The standard NHS rheumatology pathway sees patients every 3 to 6 months. Between appointments, flares are missed and treatment effect is estimated rather than measured. The DDAS fills that gap, letting a clinician see whether a patient is improving or deteriorating with the same directional certainty as an in clinic visit. For investors, this is the difference between a screening tool and a monitoring platform.
Agreement and banding
Correlation shows the two scores move together. Agreement shows whether a clinician can read the digital score on the thresholds they already use.
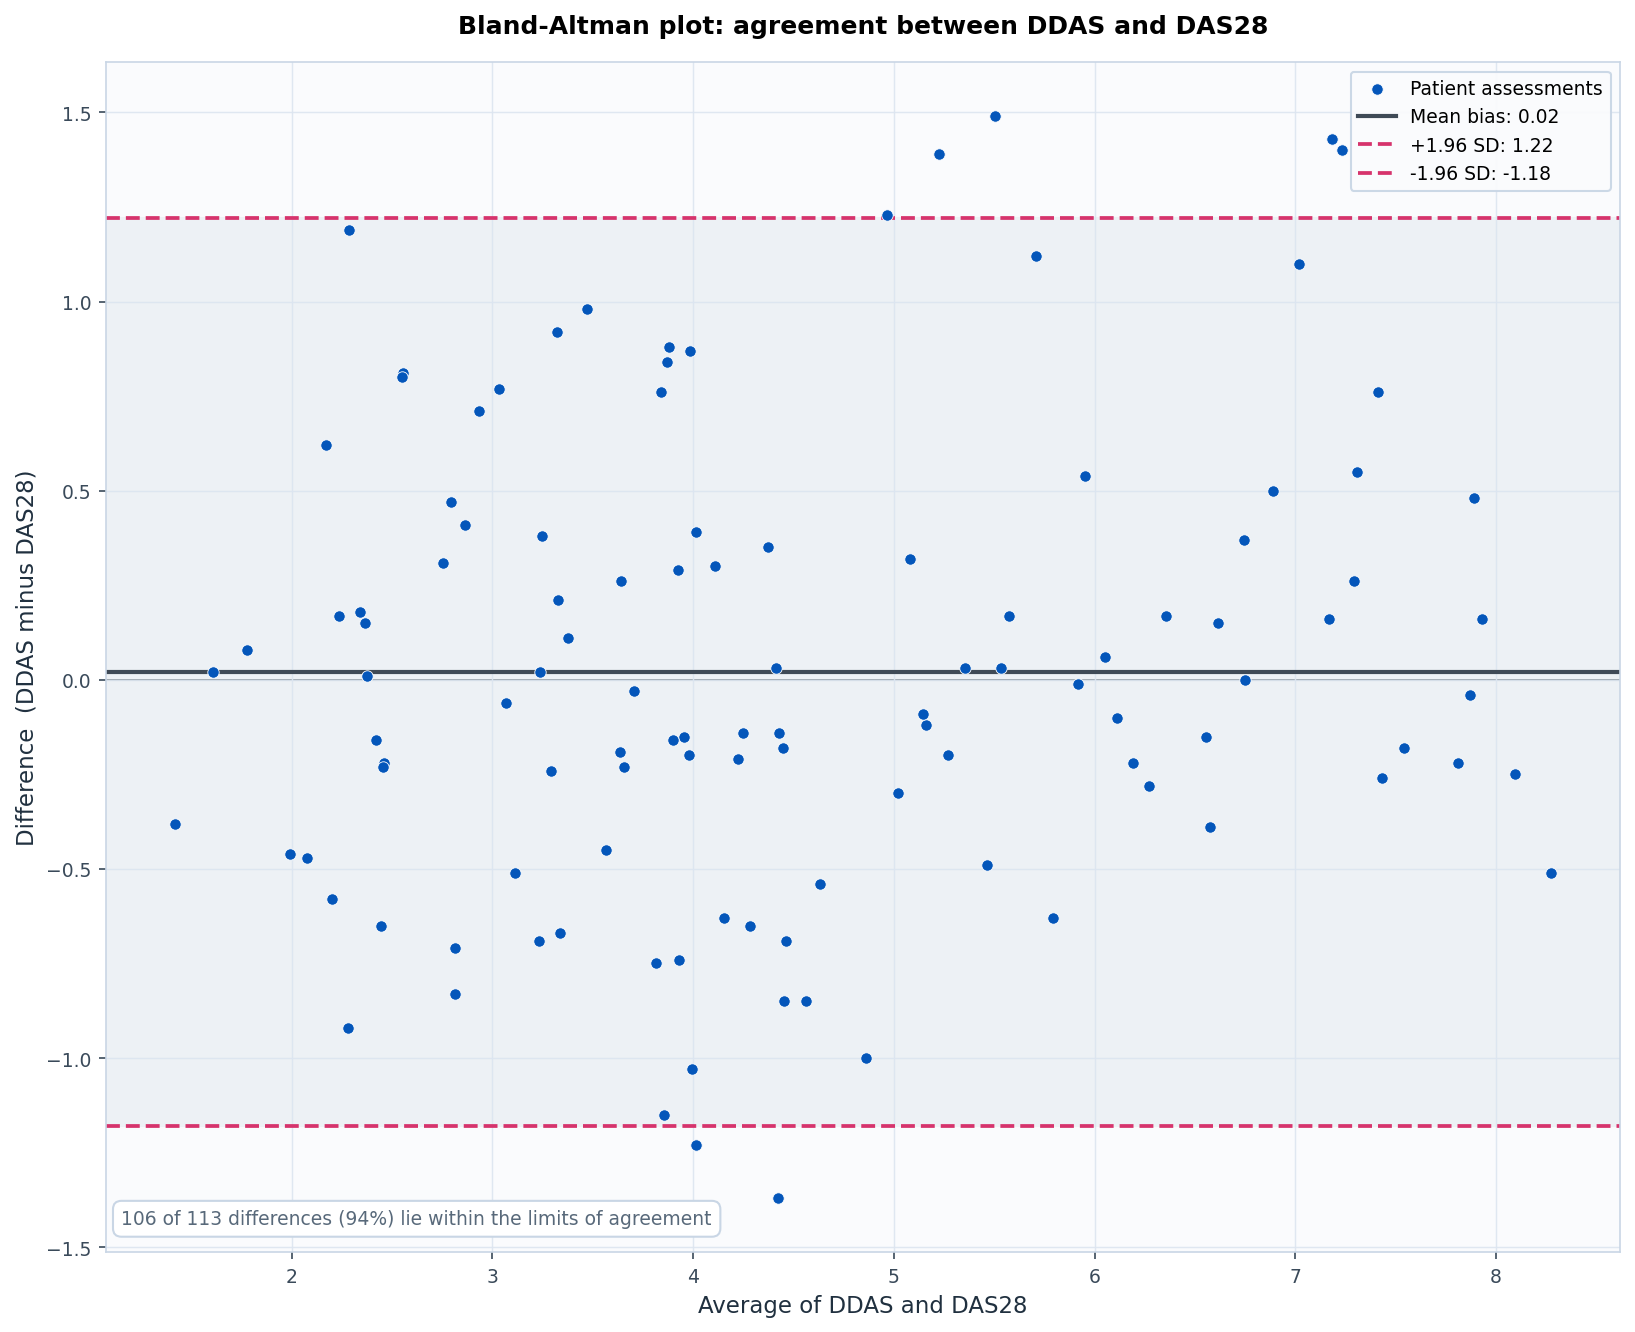
Bland and Altman analysis gives a mean bias of 0.02 points, 95% confidence interval -0.09 to +0.14, with limits of agreement from -1.18 to +1.22. A bias this close to zero means the DDAS does not systematically read high or low against DAS28. The mean absolute error between a DDAS reading and its matched DAS28 is 0.48 points, with a median of 0.38.
- Exact band match, 78.8 percent, 89 of 113. Across the four standard DAS28 activity bands of remission, low, moderate and high disease activity.
- Within one band, 98.2 percent, 111 of 113. Only two assessments in the whole set fall more than one band away from the clinical score.
- Three group exact match, 85.0 percent, 96 of 113. Grouping remission with low activity, as most treatment decisions do.
- High disease activity band, 92.5 percent agreement, 37 of 40. The band that triggers escalation is the band the score matches most reliably.
- Sensitivity 92.5 percent, specificity 94.5 percent. Calculated separately, against the DAS28 threshold of 5.1 for high disease activity. At target, 3.2 or below: 82.8 percent and 94.0 percent. Remission, below 2.6: 73.7 percent and 95.7 percent.
Vision model performance
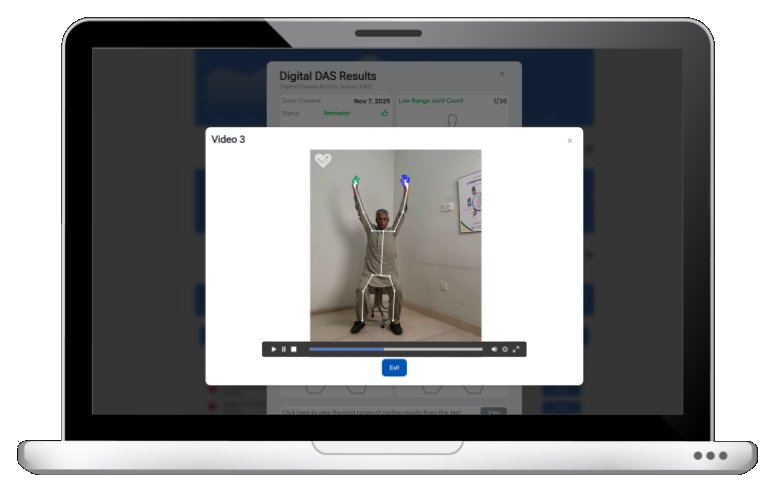
The model underpinning Synovo's motion analysis engine, built with proprietary in house vision models, detected and tracked joint landmarks across all test videos for the joint analysis and range of motion calculation that feed the DDAS. The figures below describe how the pipeline performed operationally. This study did not validate the vision model against an annotated ground truth reference, so they are measures of processing reliability, not of measurement accuracy.
- No exclusions. All 452 videos across the 113 assessments were processed and none were excluded. Each was recorded at the study visit, alongside the clinician assessment. Performance under unsupervised home recording was not assessed in this study.
- Landmark confidence. The model reported a mean per frame landmark confidence of 96 percent. This is the model's own internal confidence measure and not a measurement of accuracy. Formal joint tracking accuracy was not assessed in this study.
- Temporal stability: multi frame smoothing kept joint tracking continuous over time, allowing longitudinal comparison of range of motion and stiffness.
Implications for clinical systems
Patient convenience
At home monitoring through a simple video capture and questionnaire. No travel, no waiting rooms, no time off work and no needles.
Clinical efficiency
Frees clinician time, surfaces flares earlier, and lets teams prioritise the patients who need to be seen in person rather than reviewing everyone on a default cycle.
Healthcare system value
Scalable, cost effective monitoring for chronic rheumatology patients across NHS trusts, with a clear pathway to similar conditions where disease activity scoring drives treatment.
Earlier intervention
Continuous between visit data means treatment can change when the disease shifts, not months later at the next scheduled appointment.
Current dataset summary
| Sample size | 113 paired assessments from 61 participants, balanced across activity levels |
| Correlation to DAS28 | Pearson r 0.94, 95% CI 0.92 to 0.96, R squared 0.89, Spearman 0.93, ICC 0.94 (95% CI 0.92 to 0.96) |
| Trend slope | DDAS = 0.99 x DAS28 + 0.07 |
| Longitudinal validation | 31 participants across follow up visits, 90.4 percent direction agreement, 47 of 52 transitions |
| Agreement | Mean bias 0.02 (95% CI -0.09 to +0.14), limits of agreement -1.18 to +1.22, mean absolute difference 0.48 points, median 0.38, RMSE 0.61 |
| Band agreement | 78.8 percent exact across four bands, 98.2 percent within one band |
| Vision pipeline | 452 videos processed, none excluded, 96 percent mean per frame landmark confidence as an internal measure |
| Study period | October 2025 to July 2026, single centre |
| Study site | Aap Ka Clinic Research Centre, Lahore, Pakistan. Ethics: Aap Ka Clinic IRB, approved 21 October 2025. Not an NHS study. |
| Model | DDAS, locked version 1.1.2 |
Next steps for validation
With the exploratory single centre study complete, the focus shifts to independent and multi centre validation and to regulatory progression. The following are planned.
- Multi centre NHS deployment. Alongside the single centre validation cohort in Lahore, which is complete, extend the separate registered NHS clinical audit to multiple centres, targeting 200 patients across at least three trusts to support regulatory progression and reimbursement evidence.
- Continued balanced sampling. Maintain the balanced design across activity bands and continue parallel ESR and CRP coverage, building reference datasets that mirror real NHS rheumatology populations.
- Clinical verification. Continue paired testing between DDAS and in clinic DAS28 across new sites to confirm repeatability and sensitivity hold under different clinician teams and patient populations.
- Algorithm refinement. Continue optimising weighting for tenderness, swelling, stiffness and function, alongside expansion to psoriatic arthritis scoring, in development with a paying partner.
- Regulatory progression. Use the validated dataset to support planned progression beyond the current MHRA Class I registration toward a higher classification appropriate for a clinical decision support tool.
Conclusion
With a Pearson correlation of 0.94, a near one to one slope, a mean bias of effectively zero and direction agreement of 90.4 percent overall, rising to 97.1 percent where the clinical score moved meaningfully, the DDAS demonstrates the consistency required for clinical use. It delivers a clinician grade disease activity score from home based assessments, reducing dependence on blood tests and in person evaluations while supporting earlier intervention and lower per patient monitoring costs.
Status. Exploratory single centre validation complete. Independent and multi centre validation ongoing.
A formatted copy of this report is also held as a PDF in the data room.
Open the PDF version